import numpy as np
import matplotlib.pyplot as plt

r = np.arange(0, 2, 0.02)
theta = 2 * np.pi * r
fig, ax = plt.subplots(
  subplot_kw = {'projection': 'polar'}
)
ax.plot(theta, r)
ax.set_rticks([0.5, 1, 1.5, 2])
ax.grid(True)
plt.show()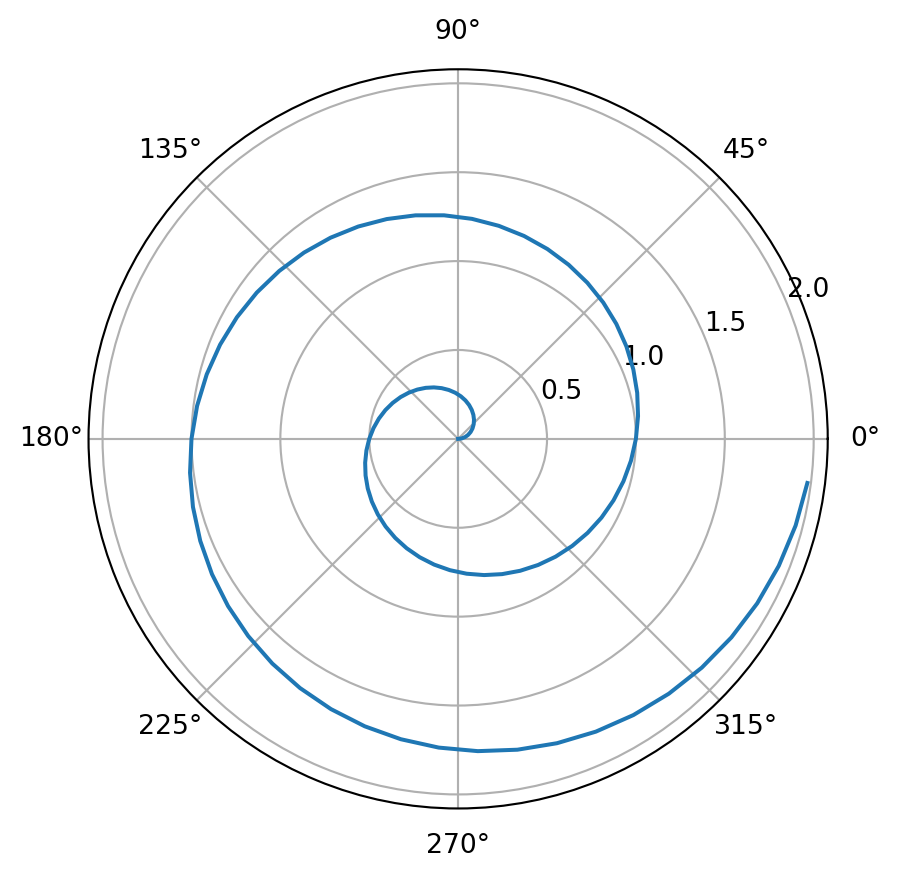
A test of the capability to display code in the blog.
This blog is authored and published with Quarto. Quarto is an open-source system specialized in technical and scientific publishing. With Quarto you can write your articles as Jupyter notebooks and then publish them as website, e-book or presentation.
The nice thing is that you can easily mix text, code, and the result of computations. Let’s see an example.
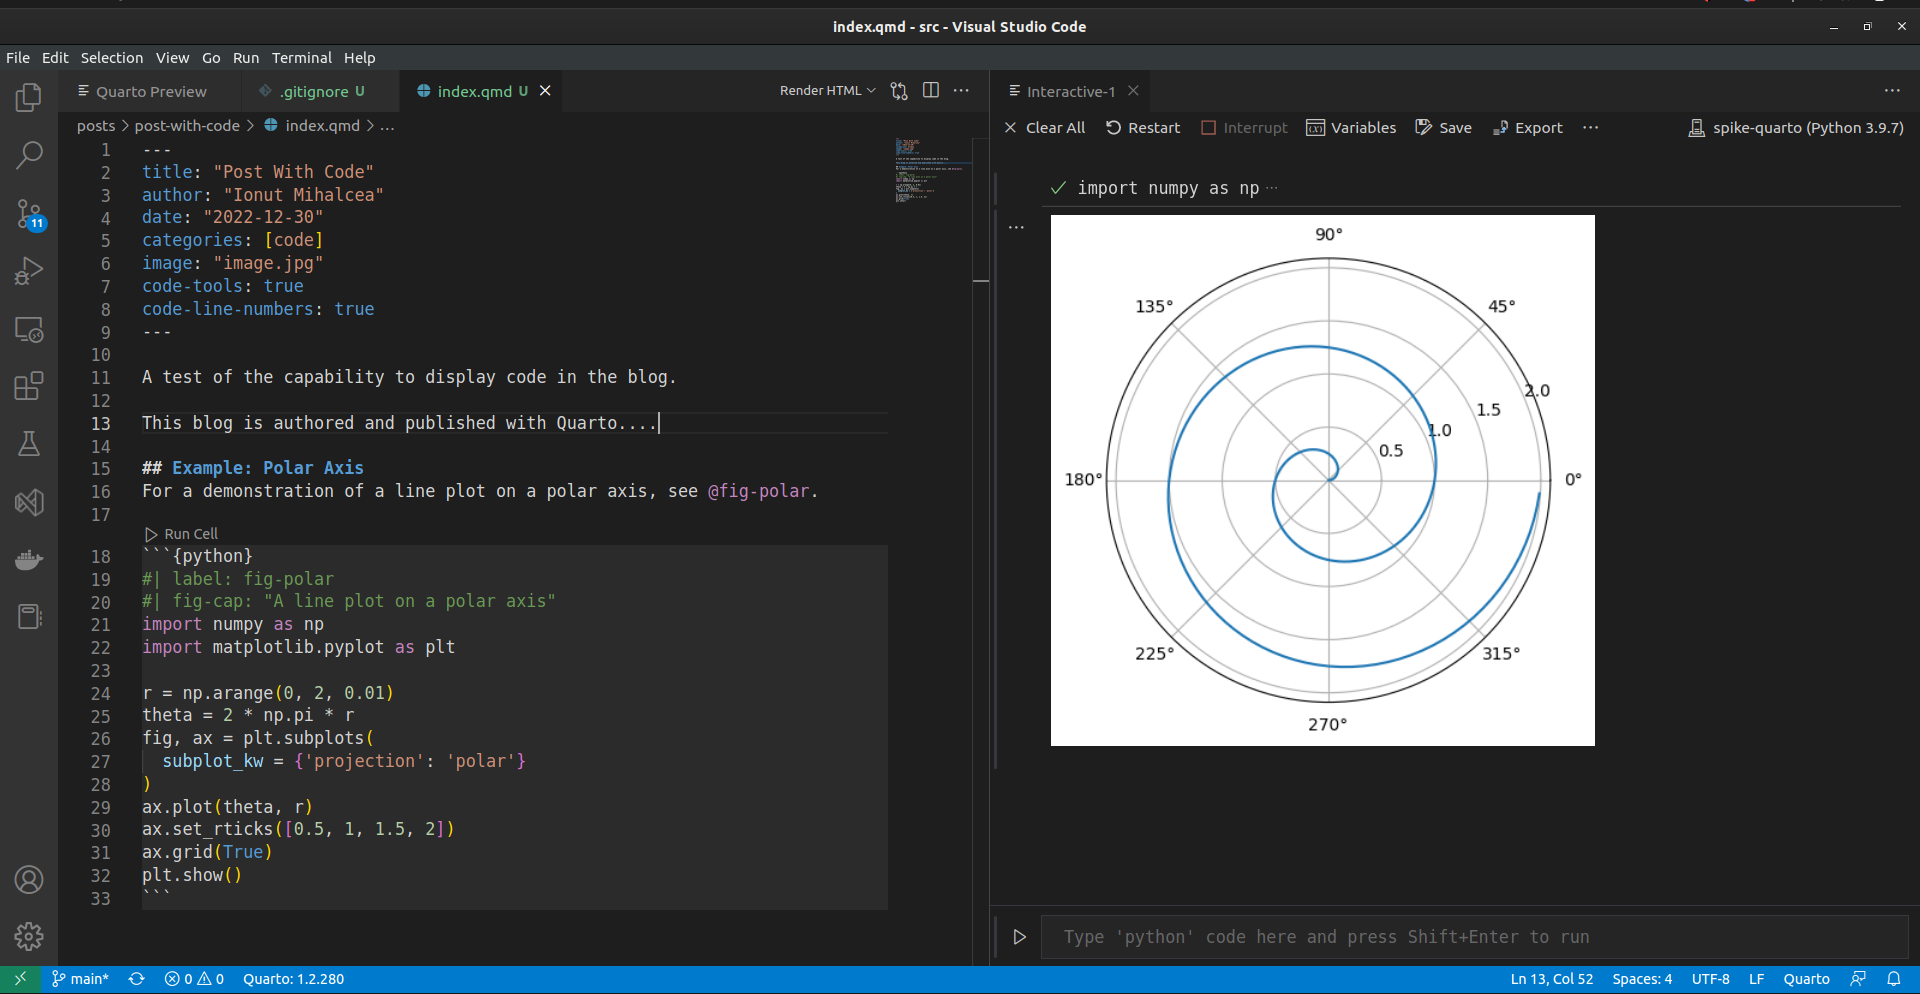
For a demonstration of a line plot on a polar axis, see Figure 1.
import numpy as np
import matplotlib.pyplot as plt
r = np.arange(0, 2, 0.02)
theta = 2 * np.pi * r
fig, ax = plt.subplots(
subplot_kw = {'projection': 'polar'}
)
ax.plot(theta, r)
ax.set_rticks([0.5, 1, 1.5, 2])
ax.grid(True)
plt.show()
And here is a screen shot of my IDE editing the source of this post.